
Introduction
If you’ve read medical papers and research in PubMed-indexed journals, you would have seen relative risk and odds ratio, often sitting side by side in the same results table. Plenty of readers treat them as one number with two names. The truth is they are not the same.
Relative risk (RR) is built from probabilities. Odds ratio (OR) is built from odds, which sounds like the same thing but isn’t. With a rare outcome, you’ll hardly notice. With a common one, say a side effect that shows up in a third of patients, the OR can come out quite a bit larger than the RR. Read it as risk, and you’ll overstate the effect.
In this article, you will see how each measure is calculated and read, why the two disagree, and when one can stand in for the other. After that, we get into which study designs call for which, how to convert an OR into an RR, and where the hazard ratio and absolute risk fit in.
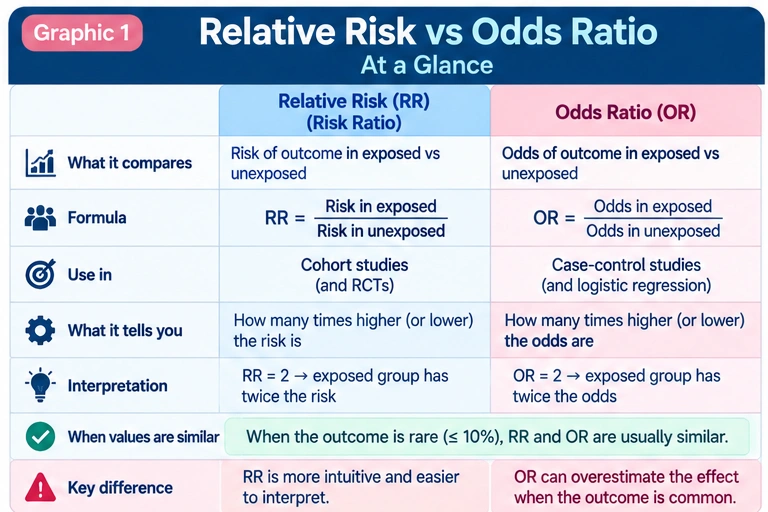
Relative Risk vs Odds Ratio at a Glance
Need the quick answer? It’s in this table.
| Feature | Relative Risk (RR) | Odds Ratio (OR) |
| Compares | Risk (probability) | Odds |
| Basic formula | Risk in exposed ÷ risk in unexposed | Odds in exposed ÷ odds in unexposed |
| Range | 0 to infinity | 0 to infinity |
| Null value (no association) | 1 | 1 |
| Commonly used in | Cohort studies, randomized controlled trials | Case-control studies, logistic regression |
| Easy to interpret? | Generally yes | Less intuitive |
| Relationship to the other | — | Close to RR when the outcome is rare |
| Common problem | Needs actual outcome risks | Sits farther from 1 than RR when the outcome is common |
The first row matters most. RR uses probabilities and OR uses odds; the rest of the table is really just what follows from that.
What Is Relative Risk (Risk Ratio)?
Relative risk (you’ll also see it called the risk ratio; same thing) compares how often an outcome happens in one group versus another. Risk, here, just means the share of a group that ends up with the outcome.
Relative Risk Formula
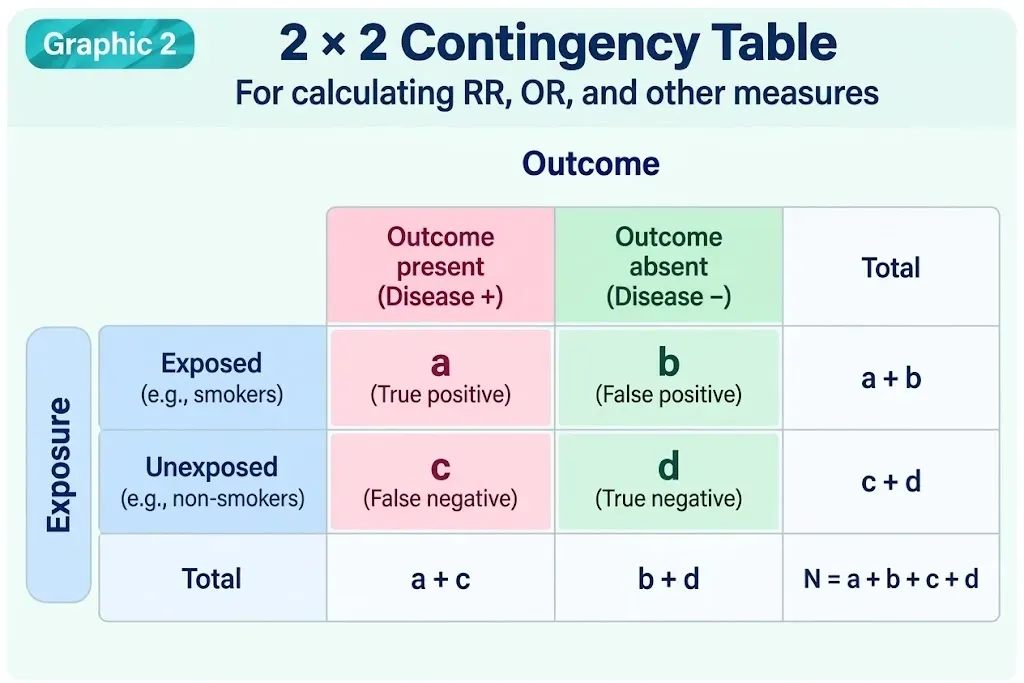
Most textbooks set it up with a 2×2 table like this one:
| Outcome + | Outcome − | Total | |
| Exposed | a | b | a + b |
| Unexposed | c | d | c + d |
The exposed group’s risk is a / (a + b). The unexposed group’s risk is c / (c + d). RR is simply the first divided by the second:
RR = [a / (a + b)] ÷ [c / (c + d)]
How to Interpret Relative Risk
An RR of 1 means no difference between the groups. Over 1, the outcome is more common in the exposed group, which is bad news if the outcome is a disease and good news if it’s recovery. Under 1, it’s the other way around.
Take 100 smokers and 100 nonsmokers followed for ten years (made-up numbers, just to keep the math easy). Twenty smokers develop the disease, and so do 10 nonsmokers. That’s 20% versus 10%, so the RR is 2.
In other words, the risk was twice as high among smokers. Just don’t stretch that into “smokers will probably get sick.” Each smoker’s actual risk in this example is still one in five.
What Is an Odds Ratio?
What Are Odds?
People use “odds” casually (“what are the odds?”), which is exactly why the statistical meaning confuses so many beginners.
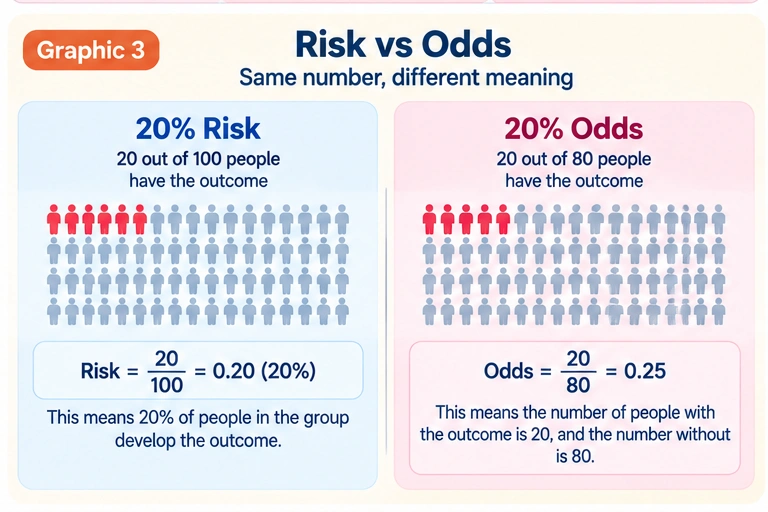
Risk puts the events over the whole group. Odds put the events over the people who didn’t have the event. So a 20% risk becomes odds of 0.20 ÷ 0.80, which is 0.25. One person with the event for every four without it.
If you ever need to switch back and forth: odds = risk ÷ (1 − risk), and risk = odds ÷ (1 + odds).
Odds Ratio Formula
OR = odds in exposed ÷ odds in unexposed
On a 2×2 table, that tidies up to OR = (a × d) ÷ (b × c), the “cross-product” you may remember from biostatistics class.
Let’s reuse the smoking example rather than start fresh. Smokers: 20 events, 80 without, so the odds are 0.25. Nonsmokers: 10 events, 90 without, so the odds are about 0.111. Divide, and the OR comes out near 2.25.
Same hundred people in each arm. Same outcomes. RR says 2; OR says 2.25. Not a huge gap in this case, but it’s there, and that’s enough to show the two aren’t the same thing.
American Academy of Research & Academics
Understand what RR and OR actually tell you.
Build the probability, regression, and interpretation skills behind these measures with AARA’s Biostatistics Online Course, using practical research examples.
Relative Risk vs Odds Ratio: What’s the Difference?
| Relative Risk | Odds Ratio | |
| Measures | Risk | Odds |
| What is compared in each group | Events ÷ total people | Events ÷ non-events |
| Formula | Risk₁ ÷ Risk₀ | Odds₁ ÷ Odds₀ |
| Interpretation | Relative change in risk | Relative change in odds |
| Typical use | Cohort studies and RCTs | Case-control studies and logistic regression |
| Rare outcome | — | Often close to RR |
| Common outcome | Directly interpretable | Can differ a lot from RR |
Strip away the table and the difference comes down to one choice: what you divide by.
For risk, the bottom of the fraction is the whole group. For odds, it’s only the people who stayed event-free. RR, then, answers “How does the chance of the outcome compare?” while OR answers “How do the odds compare?”
Why does that matter? Imagine a disease that hits 1 person in 500. Everyone in the group and everyone without the disease are basically the same crowd, so risk and odds barely differ. Now imagine an outcome that affects half the group. Suddenly the two denominators look nothing alike, and the ratios follow suit.
Why Are Odds Ratios Sometimes Larger Than Relative Risks?
“The OR overestimates the RR.” You’ve probably read that line somewhere. It isn’t wrong, exactly, but it hides the mechanism, and the mechanism is the useful part.
Try a common outcome. In the exposed group, 40 of 100 people develop it. In the unexposed group, 20 of 100 do.
RR: 0.40 ÷ 0.20 = 2.0.
Odds for the exposed group are 40 ÷ 60, or 0.667. For the unexposed group, 20 ÷ 80, or 0.25. OR: 0.667 ÷ 0.25 = 2.67.
Why the jump? Every extra event in a group also removes one person from the non-event column. Odds get hit twice: the top of the fraction grows while the bottom shrinks. In the exposed group, the denominator went from 100 (for risk) down to 60 (for odds). Risk can’t do that, so it rises more slowly.
A more careful way to put the “overestimate” idea: when the OR is above 1, reading it as an RR tends to exaggerate the effect. When the OR is below 1, it lands further below 1 than the matching RR. The higher the baseline risk and the stronger the association, the wider the gap.
When Does Odds Ratio Approximate Relative Risk?
Rare outcomes are where the OR earns its reputation as a stand-in for the RR. You’ll see this called the rare disease assumption.
The reasoning is almost obvious once you’ve seen the denominators. With a rare outcome, the non-events make up nearly the whole group, so risk and odds come out practically equal. A 1% risk, for example, is odds of 1 ÷ 99, about 0.0101.
Numbers make it concrete. Say 2 in 1,000 exposed people have the event (risk 0.002, odds about 0.002004), and 1 in 1,000 unexposed people do (risk 0.001, odds about 0.001001). RR is 2.0. OR is 2.002. You couldn’t tell them apart on a forest plot.
So what counts as “rare”? Plenty of textbooks settle on about 10% as a working rule. Treat it as a rough guide, not a law. The OR and RR drift apart gradually, and how far depends on the outcome frequency and the size of the effect together.
Relative Risk vs Odds Ratio in Different Study Designs
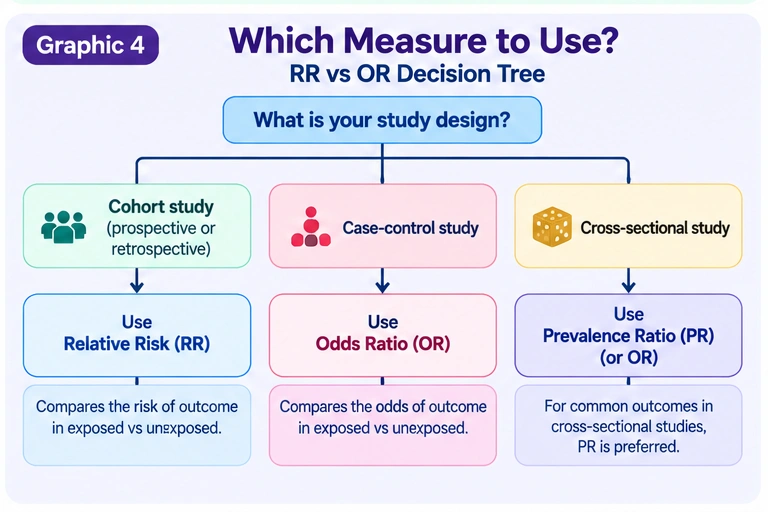
Often the study design makes the choice for you.
Cohort Studies
Cohort studies start with exposure. People are grouped as exposed or unexposed and then followed to see who develops the outcome. Since you know both the starting numbers and the final counts, risk falls right out of the data. RR is the obvious fit.
Randomized Controlled Trials
Trials work much the same way, except chance decides who gets the treatment. Count the events in each arm and you have the event rates, and from there the RR. Trials also make it easy to report the risk difference (absolute risk reduction) and the number needed to treat (NNT). Clinicians tend to find those far more useful at the bedside than any ratio.
Case-Control Studies
This is the design where RR simply doesn’t work. Researchers recruit people who already have the outcome (cases) and a comparison group who don’t (controls), then look back at past exposures. The study team decides how many of each to enroll, perhaps one control per case, perhaps four. That ratio is an artifact of the design, not a reflection of how common the disease is in the population. Risk calculated from it would be meaningless.
The OR survives this problem. It can still be estimated correctly from how often cases and controls were exposed, which is why case-control studies report ORs.
Logistic Regression
Much of the OR’s popularity comes from logistic regression, the standard tool for yes/no outcomes. Its coefficients translate directly into odds ratios. When authors adjust for confounders like age, sex, or smoking, the result is an adjusted OR. That’s why you’ll see ORs in cross-sectional and cohort papers too, not just case-control work.
American Academy of Research & Academics
Choose a study design that fits your research question.
Cohort studies and case-control studies answer questions in different ways. Learn study design, bias, and confounding with AARA’s Basic Research Methodology course.
How to Interpret RR and OR
The basic reading is the same for both. At 1, there’s no difference between groups. Above 1, the outcome is more frequent among the exposed on that scale. Below 1, it’s less frequent.
An RR of 1.5 means 50% higher risk. An RR of 0.70 means 30% lower risk. Straightforward.
An OR of 2 needs more care. It means twice the odds, which is not necessarily twice the risk. This is probably the single most common error in how ORs get reported, in the news and sometimes in the papers themselves.
How to Read an OR in a Research Paper
Suppose you come across this in a results section: Adjusted OR = 1.8 (95% CI 1.2–2.7).
Read it as: after adjustment, the exposed group had 1.8 times the odds of the outcome. The whole confidence interval sits above 1, so the data are consistent with a real association at the usual 5% level.
Now the part many readers miss. This does not mean an 80% higher risk. If you want the RR, you also need the baseline risk in the unexposed group, and the OR won’t give you that on its own.
Relative Risk vs Odds Ratio vs Hazard Ratio
Then there’s the hazard ratio (HR), which appears mainly in studies that track people over time.
| Measure | What it compares | Common application |
| RR | Risk (probability) | Cohort studies, RCTs |
| OR | Odds | Case-control studies, logistic regression |
| HR | Instantaneous event rate over time | Survival (time-to-event) analysis |
The HR isn’t a cousin of RR or OR so much as a different tool. RR and OR ask whether the event happened by some cutoff. The HR also cares about timing. Picture two cancer drugs with the same five-year death count, where most deaths in one arm happened in year one. RR at five years would call them equal. The HR wouldn’t. That’s why survival analyses, usually built on Cox regression, report HRs.
Absolute Risk vs Relative Risk vs Odds Ratio
Ratios can mislead in a quiet way. They tell you how much bigger one number is than another, but not how big either number is.
Say Group A has a 2% risk and Group B has 1%. The RR is 2, and a headline might call it “doubled risk.” In absolute terms, though, the difference is one percentage point. You’d need to expose roughly 100 people to see one extra case.
Keep the RR at 2 but change the risks to 40% and 20%, and the absolute gap becomes 20 percentage points. Same ratio, very different story for patients.
This is why journals such as The BMJ push authors to report absolute event rates alongside relative ones wherever possible. The ratio shows the strength of the link. The absolute numbers show whether anyone should care.
How to Convert Odds Ratio to Relative Risk
You can turn an OR into an estimated RR, provided you know the baseline risk in the unexposed or control group:
RR = OR ÷ [(1 − P₀) + (P₀ × OR)]
P₀ is that baseline risk.
Using our earlier example (OR = 2.25, P₀ = 0.10):
RR = 2.25 ÷ [(1 − 0.10) + (0.10 × 2.25)] = 2.25 ÷ 1.125 = 2.0
Which is exactly the RR we got by hand.
Notice what happens if the baseline risk changes, though. With P₀ at 1%, the same OR of 2.25 gives an RR near 2.22. With P₀ at 30%, it drops to roughly 1.64. One OR, several possible RRs. Without the baseline risk, don’t guess; interpret the OR as an OR.
Common Mistakes When Comparing RR and OR
Mistake 1: Calling an OR “times the risk.” An OR of 3 is three times the odds. Risk may have risen by much less.
Mistake 2: Using OR and RR interchangeably. Fine for rare outcomes, often close enough. For common outcomes, the numbers can be far apart.
Mistake 3: Assuming the same OR always means the same increase in risk. It doesn’t. Baseline risk changes what any given OR translates to.
Mistake 4: Calculating RR from a standard case-control study. The case-to-control ratio was set by the researchers, so it can’t stand in for population risk.
Mistake 5: Ignoring the confidence interval. A point estimate with no interval tells you nothing about precision. If the interval is wide, or crosses 1, slow down.
Mistake 6: Reading association as causation. An RR or OR shows the exposure and outcome travel together. Confounding, bias, or chance could still explain the link, especially in observational data.
RR vs OR: Which One Should You Use?
There’s no winner here. The better measure is the one your design and data can actually support. A few quick rules:
- Cohort study where you can calculate risk in each group? RR is usually the natural choice.
- Randomized trial? Report RR, and consider the risk difference and NNT as well.
- Participants recruited by outcome status, as in a case-control study? Use the OR.
- Logistic regression with adjustment for confounders? The adjusted OR is what you’ll report.
- Interested in how quickly events happen, not just whether they happen? Look at the hazard ratio.
- Cross-sectional data? A prevalence ratio or prevalence odds ratio, depending on your analysis.
Final Thoughts
RR and OR aren’t competitors. They answer slightly different questions, and each one fits certain study designs better than the other. The trouble only starts when an OR gets read as if it were a risk, especially with a common outcome, where the two can be far apart.
When you run into either one in a paper, check three things: which measure the authors actually used, how common the outcome was, and whether they gave absolute numbers alongside the ratio. Those three checks will save you from most of the misreadings covered above.
Need Help With Your Research?
Choosing the right effect measure is only one step in getting a study right. If you’re working on a research project, a systematic review, or a statistical analysis and want expert guidance, the American Academy of Research and Academics (AARA) can help. Reach out to our team to discuss your project and get support from researchers who work with these methods every day.
American Academy of Research & Academics
Working with RR or OR in your own research?
Discuss your study design and analysis needs with AARA. Ask about research mentorship to help you interpret your findings and prepare your work for publication.
Frequently Asked Questions
Q1. Is relative risk the same as risk ratio?
Yes, just two names for one measure.
Q2. Is odds ratio the same as relative risk?
No. OR compares odds and RR compares risks. They only line up closely when the outcome is rare.
Q3. Which is easier to interpret, RR or OR?
Most people find RR easier, since it compares probabilities, and probabilities feel more natural than odds.
Q4. Why is odds ratio used in case-control studies?
Because these studies recruit by outcome, they can’t tell you the true risk in the population. The OR can still be estimated correctly from exposure rates among cases and controls.
Q5. When is OR approximately equal to RR?
When the outcome is rare. Around 10% is a common working rule, though no cutoff holds in every situation.
Q6. Can OR be greater than RR?
Yes. An OR above 1 usually sits farther from 1 than the RR from the same data, and the gap widens as the outcome gets more common.
Q7. What does RR < 1 mean?
Lower risk in the exposed or treatment group compared with the other group. An RR of 0.8, for example, is a 20% reduction.
Q8. What does OR = 1 mean?
The odds are equal in both groups, which means no association between exposure and outcome.
Disclaimer:
Articles published by American Academy of Research & Academics are prepared by our team using information from direct experience, publicly available resources, and educational references. AI tools may be used to assist with drafting, proofreading, and formatting; however, all content undergoes review and approval before publication.
The information provided is intended for educational purposes only. Requirements, policies, and processes may change over time. Readers should consult official sources for the most current information.