
Introduction
Someone has told you to use RevMan for your systematic review. You’ve opened it, looked at the screen, and closed it again. That happens to almost everyone. RevMan stands for Review Manager. Cochrane built it for systematic reviews and meta-analyses, and plenty of researchers outside Cochrane use it too. It isn’t complicated software, but it assumes you already know how a review is structured, which is a rough assumption if nobody has taught you that part yet.
So this guide starts earlier than most. You’ll set up a Cochrane account, get into RevMan Web, structure a review properly, enter dichotomous and continuous data, build a forest plot, fill in a risk of bias table, export your figures, and see how RevMan stacks up against CMA.
What is RevMan? RevMan is Cochrane’s software for preparing and analyzing systematic reviews. You use it to enter study data, run meta-analyses, record risk of bias judgments, and turn all of that into figures and tables.
What is RevMan and What is It Used For?
Most people start a review with data scattered everywhere. Studies in one spreadsheet. Extracted numbers in another. Half-finished calculations in a third file nobody can find. RevMan pulls all of it into one workspace that’s already shaped like a systematic review.
What can you do with RevMan?
- Keep your included studies organized in one place
- Enter outcome data study by study
- Run a meta-analysis
- Handle dichotomous outcomes (events and non-events)
- Handle continuous outcomes (measurements on a scale)
- Produce forest plots
- Record and display risk of bias
- Build review tables and figures
- Export those figures for your manuscript or slides
Where RevMan shines is the review workflow itself. Where it doesn’t help you at all is judgment. The software will run an analysis on badly extracted data and give you a clean, confident-looking result, because it has no way of knowing your question was vague or that you pulled the wrong column out of Table 2.
Worth saying early: RevMan won’t teach you effect measures, confidence intervals, heterogeneity, or the difference between fixed and random effects. Learn those alongside the software. Each of those has its own guide here: medical statistics for beginners, heterogeneity in meta-analysis, and fixed effect versus random effects. Read them in that order if the whole area is new. People who skip that step end up with beautiful forest plots they can’t interpret.
Biostatistics
RevMan will run an analysis on badly extracted data and hand you a clean result.
It has no way of knowing your question was vague or that you pulled the wrong column out of Table 2. Effect measures, confidence intervals, weighting and heterogeneity are the part the software cannot supply. Learn them alongside it, not after.
How to Set Up a Cochrane Account
Everything runs through a Cochrane account, so start there.
Step 1. Create your Cochrane account
- Go to the Cochrane website.
- Find the sign-in or register option.
- Register using your email address.
- Verify the email if you’re prompted to.
- Log in.
Takes about five minutes. Use your institutional email if you have one, since some access options and discounted rates are tied to your university.
Step 2. Access RevMan Web
With the account active, head to the RevMan Web login page. RevMan Web runs in your browser, so there’s nothing to install and it doesn’t matter whether you’re on Windows or a Mac. Your review saves to your Cochrane account, which also makes co-author access far less painful than emailing files back and forth.
Beginner tip: Bookmark the login page now. Partly to save time, mostly so you stop landing on old tutorials written for the desktop version, which looks different enough to confuse you.
How to Start a Review in RevMan Web
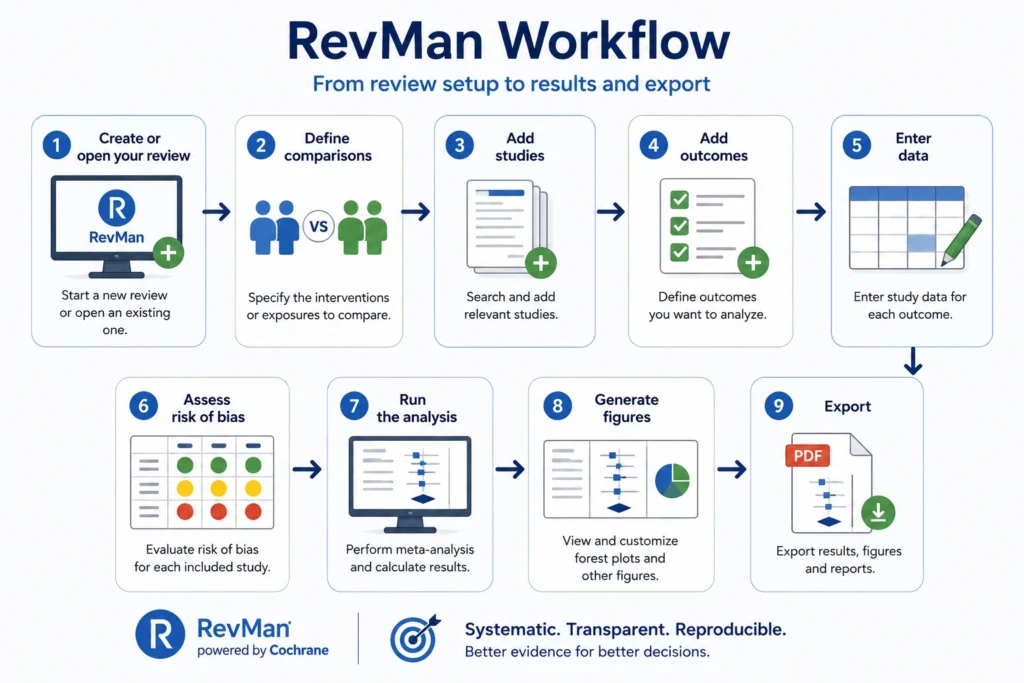
Here’s the shape of the whole thing:
Create or open your review → define comparisons → add studies → add outcomes → enter data → assess risk of bias → run the analysis → generate figures → export.
Before you click anything, get four words straight. Beginners mix these up constantly and it causes real problems downstream.
- Study is one trial, one paper.
- Comparison is the two things you’re pitting against each other.
- Outcome is the specific result you’re measuring.
- Analysis is the pooling of results across studies.
Say your review looks at Drug A versus placebo for reducing migraine frequency.
- Comparison = Drug A versus placebo
- Outcome = migraine frequency
- Studies = the individual trials you included
- Analysis = the pooled result across those trials
One comparison can hold several outcomes. One outcome can hold many studies. Once that nesting makes sense to you, most of RevMan is just careful typing.
The nesting mirrors the review itself, which is why it feels obvious once the review is properly planned. How to write a systematic review and meta-analysis covers where comparisons and outcomes get decided, long before you open any software.
How to Enter Dichotomous Data in RevMan
A dichotomous outcome has two states. Either the event happened or it didn’t. Died or survived. Infected or not infected. Improved or didn’t improve.
What data do you need?
Four numbers per study:
| Treatment group | Control group |
| Number of events | Number of events |
| Total participants | Total participants |
Say Study A reports 20 events out of 100 participants in the treatment arm, and 30 out of 100 in the control arm. That’s everything RevMan needs from that paper for this outcome.
Steps for entering dichotomous data
- Open the comparison you’re working on.
- Pick the existing outcome, or make a new one.
- Set the outcome type to dichotomous.
- Enter the event count for each group.
- Enter the total participants in each group.
- Do the same for every included study.
- Go back and check your numbers against the papers before you run anything.
That last step is not optional, however tempting it is to skip.
Common effect measures
You’ll usually be choosing between three:
- Risk Ratio (RR) compares the risk of the event between groups.
- Odds Ratio (OR) compares the odds.
- Risk Difference (RD) is the absolute difference in risk.
They answer different questions and they aren’t interchangeable. If you’re not sure which fits your review, read a proper explainer on RR versus OR before you commit to one.
Common mistake: Don’t type percentages into a field asking for event counts. Don’t put means into a dichotomous outcome. And double-check that your treatment column really is the treatment group, because swapping the two flips your entire result and nothing on screen will warn you.
How to Enter Continuous Data in RevMan
Continuous outcomes get measured on a scale instead of counted as events. Blood pressure. Pain scores. Depression scores. Length of hospital stay. Weight.
What data do you need?
Three values, for each group in each study:
- Mean
- Standard deviation (SD)
- Number of participants
For example, treatment with a mean of 5.2, SD of 1.4, and 100 participants, against control with a mean of 6.1, SD of 1.6, and 100 participants.
Steps for entering continuous data
- Select or create your outcome.
- Set the data type to continuous.
- Enter the treatment group mean.
- Enter the standard deviation.
- Enter the sample size.
- Repeat all three for the comparison group.
- Check the units and the direction of effect before you move on.
Mean Difference vs Standardized Mean Difference
Use Mean Difference (MD) when every study measured the outcome the same way. All your trials reported systolic blood pressure in mmHg? MD.
Use Standardized Mean Difference (SMD) when studies measured the same underlying thing with different instruments. One trial used the Beck Depression Inventory, another used the Hamilton scale. SMD lets you pool them.
Watch out: Confirm that a higher score means the same thing in every study. On some scales higher is better, on others higher is worse. Pool them without checking and your effect can point the wrong way while looking completely fine.
How to Generate a Forest Plot in RevMan
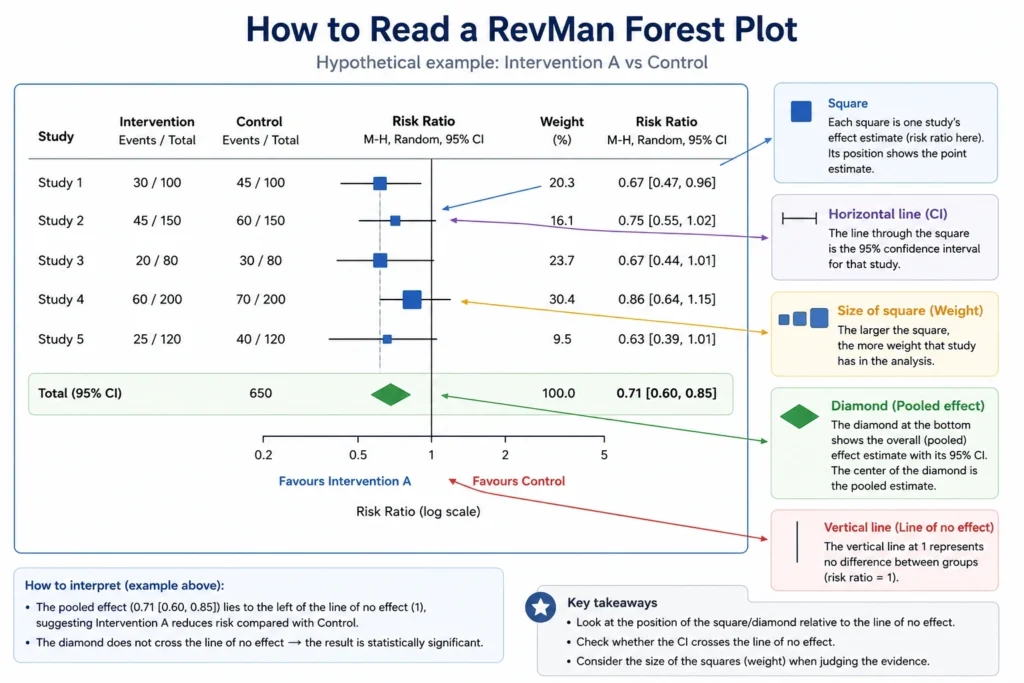
The forest plot is the figure everyone recognizes from a meta-analysis. One image carries the effect estimate from each study, the confidence interval around each one, how much weight each study contributes, the pooled effect, and the confidence interval around that pooled estimate.
Steps for generating a forest plot
- Enter your study data for the outcome.
- Confirm the outcome type and effect measure.
- Open the analysis.
- Choose your statistical model, fixed effect or random effects.
- Run or view the analysis.
- RevMan draws the plot from your data.
You never draw it yourself. It also redraws whenever your data change, which is one of the better reasons to use the software at all.
How to read a RevMan forest plot
- The square is one study’s effect estimate.
- The horizontal line through it is that study’s confidence interval.
- The size of the square shows how much weight the study carries.
- The diamond at the bottom is the pooled effect.
- The vertical line is the line of no effect.
Where that vertical line sits depends on your effect measure. With RR and OR it’s at 1. With MD and SMD it’s at 0. Mixing that up is a classic first-review error.
There is more in the figure than these five elements. How to read a forest plot covers the weight column, subgroup diamonds, and what a wide diamond is actually telling you about precision.
Important: A forest plot doesn’t prove a treatment works. Read it next to the size of the effect, the width of the intervals, the heterogeneity between studies, the quality of the trials you included, and whether the result means anything at the bedside.
Meta-Analysis
Clicking random effects takes one second. Defending the choice takes rather longer.
Model selection, the heterogeneity line under the plot, subgroup analysis, sensitivity checks, publication bias. RevMan produces all of it and explains none of it. Twelve weeks working through real datasets until the output is something you can put in front of a reviewer.
How to Create a Risk of Bias Table in RevMan
Your meta-analysis is only as good as the studies inside it. Pool five weak trials and you get a precise-looking number resting on very little. The risk of bias table is how you show readers what the evidence base actually looks like instead of hiding it behind a diamond.
What is a risk of bias table?
It’s a summary of your judgments about methodological problems in each included study. Depending on the tool you’re using, you might be assessing:
- The randomization process
- Allocation concealment
- Blinding of participants, staff, or outcome assessors
- Missing outcome data
- Selective reporting
Which domains you get depends on the risk of bias tool that suits your study design. Randomized trials and non-randomized studies are assessed with different tools, so pick the right one before you start judging anything.
How to add risk of bias assessments
- Open the study.
- Go to its risk of bias section.
- Choose the tool that matches the study design.
- Work through the domains one at a time.
- Record your judgment.
- Add a short justification, ideally quoting what the paper actually said.
- Review the finished table across all your studies.
Researcher tip: Don’t mark something “low risk” just because the paper never mentions a problem. “Not reported” and “low risk” are two different judgments. A silent methods section is missing information, not proof of good practice.
How to Export Figures From RevMan
Eventually your figures need to leave the software, usually for a manuscript, a thesis chapter, or a conference slide. Forest plots and risk of bias figures are the two you’ll export most, plus whatever review tables you need.
The routine is the same each time. Open the figure, choose the export or copy option, pick your format and resolution, save it, then actually open the saved file and look at it.
Manuscript tip: Check the font size, the resolution, the study labels, the axis labels, and whether anything got clipped at the edges. Then read the journal’s instructions for authors. Journals don’t all accept the same formats or resolutions, so look it up rather than assuming yours is fine.
RevMan vs CMA: Which One Should You Use?
Comprehensive Meta-Analysis, usually just called CMA, is the name that comes up most often as an alternative.
| Feature | RevMan | Comprehensive Meta-Analysis (CMA) |
| Systematic reviews | Excellent | Yes |
| Meta-analysis | Yes | Yes |
| Forest plots | Yes | Yes |
| Risk of bias presentation | Strong | More limited, different workflow |
| Cochrane workflow | Strong | No |
| Ease for beginners | Beginner-friendly | Beginner-friendly |
| Advanced statistical options | More limited in some areas | Broader in several areas |
| Best suited for | Systematic reviews and Cochrane-style workflows | Dedicated meta-analysis and advanced analyses |
So which one should a student pick? If you’re learning review methodology, or you’re working on something Cochrane-style, start with RevMan. It’s built around the review process, so it teaches you the structure while you’re using it. If your project needs statistical methods RevMan doesn’t cover, look at CMA. Neither is better in the abstract. They were designed for different jobs, and plenty of researchers end up using both across different projects.
Common RevMan Mistakes Beginners Should Avoid
1. Entering the wrong data type: Continuous outcomes entered as dichotomous, or the reverse. The output means nothing and looks normal.
2. Mixing up intervention and control: This reverses your effect direction. The plot still renders perfectly.
3. Percentages instead of event counts: Read what the field is actually asking for.
4. Ignoring units: Pooling mmol/L with mg/dL, for instance. Convert first.
5. Picking the wrong effect measure: RR, OR, MD, and SMD answer different questions.
6. Stopping at the p-value: Effect size and confidence interval matter more than a threshold.
7. Copying numbers from someone else’s review: Always go back to the original paper and verify.
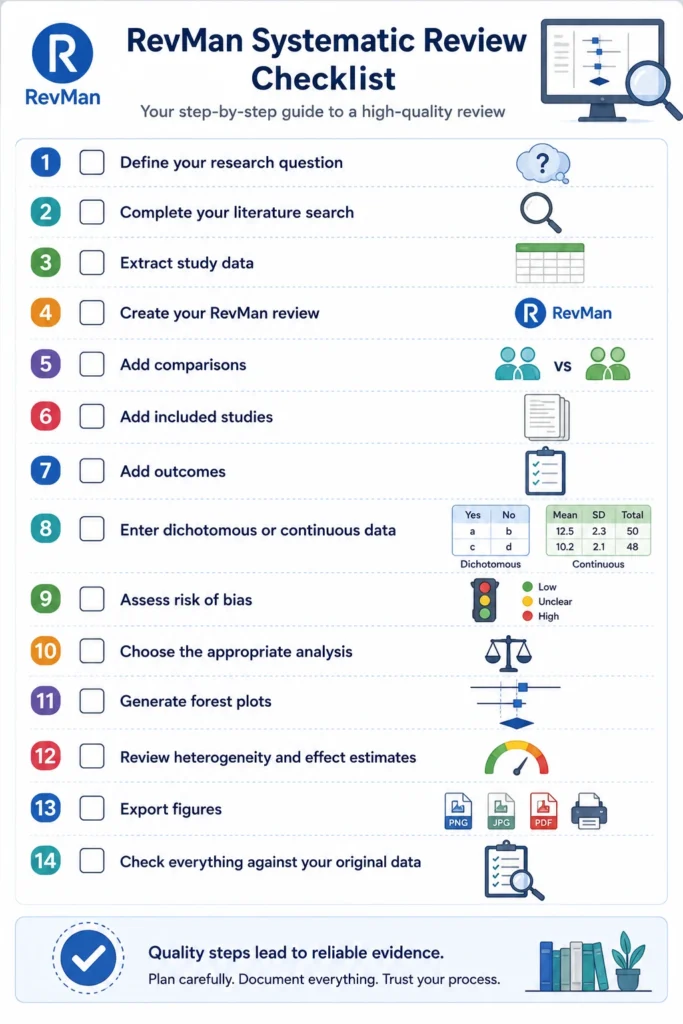
RevMan Tutorial: Quick Workflow Checklist
Frequently Asked Questions About RevMan
Q1. What is RevMan used for?
RevMan is Cochrane’s software for systematic reviews and meta-analyses. It organizes your included studies, takes dichotomous and continuous outcome data, runs the pooled analysis, stores your risk of bias judgments, and produces publication-ready figures like forest plots.
Q2. Is RevMan free?
Depends who you are. Cochrane authors working on a Cochrane review get free access, and free access is also available to researchers in Research4Life countries. Everyone else needs a subscription, with separate rates for institutions, individuals, academics, and students. Access terms change, so check Cochrane’s current subscription page instead of trusting a number from an older blog.
Q3. Can I use RevMan for meta-analysis?
Yes. Pooling results across studies is one of its main jobs, for both dichotomous and continuous outcomes.
Q4. Is RevMan Web better than desktop RevMan?
RevMan Web is the browser-based version and it’s where development is now focused. It has its own workflow and feature set. New users generally start there, though that doesn’t make older desktop versions wrong for a project already built in one.
Q5. Can RevMan create forest plots?
Yes, automatically, from the data you enter for an outcome.
Q6. Can RevMan calculate risk ratios and odds ratios?
Yes, for dichotomous outcomes, along with risk differences. What’s available depends on how you set the outcome up.
Q7. Can RevMan handle continuous outcomes?
Yes. It supports mean difference and standardized mean difference, calculated from the means, SDs, and sample sizes you enter.
Q8. Is RevMan good for beginners?
It is. The software mirrors the structure of a review, so it teaches the workflow as you go. Just make sure you understand the statistics behind what it hands you.
Final Takeaway
RevMan gets much easier once the workflow behind a systematic review makes sense to you. Structure the review properly, extract your data carefully, and the software handles the organizing, the pooling, the risk of bias table, and the figures.
One suggestion before you open your real project. Build a practice review with three or four studies and a single outcome. Enter the data, run the analysis, and read the plot. An hour on a small fake dataset will save you a week of frustration on the real one.The American Academy of Research and Academics works with medical students, residents, and physicians who want to develop genuine research skills, from systematic review methodology and meta-analysis through to manuscript writing and publication strategy. If you’re ready to build a research portfolio that holds up, take a look at what we offer.
Systematic Review
RevMan assumes you already know how a review is structured.
That is a rough assumption if nobody has taught you that part yet, and it is why the software feels harder than it is. Comparisons, outcomes and analyses only nest sensibly once the review itself does. Get the question, the protocol and the extraction right and RevMan becomes careful typing.
The American Academy of Research & Academics works with medical students, residents and physicians building genuine research skills, from systematic review methodology and meta-analysis through to manuscript writing and publication strategy. If you are ready to build a research portfolio that holds up, this is where it starts.
Disclaimer:
Articles published by American Academy of Research & Academics are prepared by our team using information from direct experience, publicly available resources, and educational references. AI tools may be used to assist with drafting, proofreading, and formatting; however, all content undergoes review and approval before publication.
The information provided is intended for educational purposes only. Requirements, policies, and processes may change over time. Readers should consult official sources for the most current information.