
If you open the raw data of any clinical investigation you will quickly notice the problem. It’s hard for anyone to see any pattern in 200 rows of patient information. That’s what descriptive statistics in medical research do; these rows are reduced to a small number of numbers that describe a patient’s demographics, clinical measures, disease characteristics and treatment outcomes.
For the rest of this study, we will refer to a hypothetical study of 200 patients. At the end you will know:
- Which methods come up most often in descriptive statistics for clinical studies
- How to pick the right measure for your data
- How to report baseline characteristics in Table 1
- How to run it all in SPSS
No statistics background needed.
What are Descriptive Statistics in Medical Research?
Descriptive statistics are used for summarizing data that is already available. They present your sample as it is – they do not attempt to test a hypothesis or make claims about patients not included in your study.
Descriptive statistical analysis in clinical research practice allows you to:
- Present raw data in a summary form that can be read
- Patterns that may be caught:Patterns that can be detected:
- Describe your patients and their needs
- Present results in tables, graphs and numbers.
The choice of statistic will depend on the type of variable.
- Continuous variables are measured on a number scale, such as age, BMI or blood pressure.
- Categorical variables classify patients into categories, such as gender, diabetes status, disease stage, etc.
Now, let’s return to our 200 patients.So let’s go back to our 200 patients. It would not be possible to write all ages in a paper. You’d give the average. Instead of giving the names of each individual patient with diabetes, you would write that 78 patients (39%) had diabetes.
Types of Descriptive Statistics Used in Clinical Research
The majority of what you’ll use is in three categories.
Expressing data with a measure of central tendency.
These will tell you the location of the middle of your data.
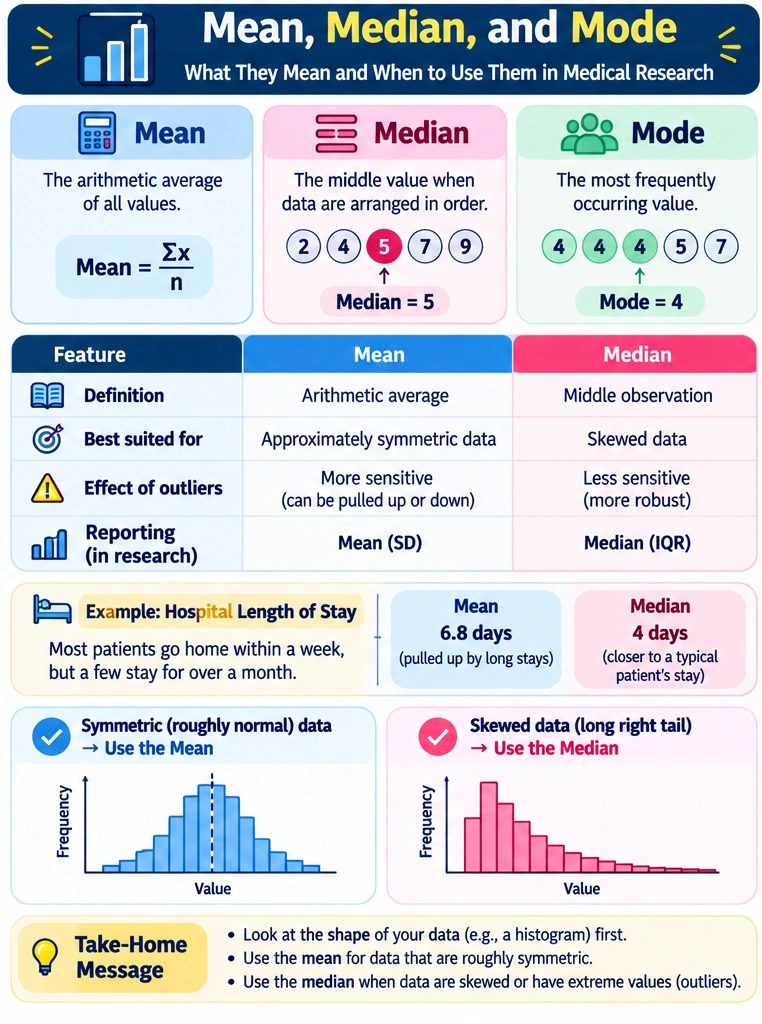
- Mean: The average. Sum up all the values and divide by the number of values. It is suitable for fairly symmetrical data.
- Median: The value that is in the middle, after arranging all values. Use it when data is skewed.
- Mode: the most common answer. Very useful for categorical or discrete data types.
If 5 patients had lengths of hospital stays of 2, 3, 3, 4, and 28 days, how many patients had a hospital stay of 28 days or longer? How many patients had a stay of 28 days or more in the hospital? The average is 8 days, but the median and mode are 3 days. That was accomplished by one long admission.
Measures of Variability or Dispersion
The middle is not enough; you need the spread as well. The mean age of 52 could come from two different studies, one with 50-year-old people and the other with people between 20 and 85 years old.
- Range: The lowest and highest values. It can be changed by one extreme value.
- Standard Deviation (SD): The average amount that values deviate from the mean. Larger SD, greater dispersion.
- Variance: The SD squared. It will be used more in calculations than in papers.
- Interquartile range (IQR): Range of the middle 50% of the values.
Frequency Distributions and Percentages
You can’t average a category, so you count it instead. The frequency is how many patients fall in a category, and the percentage is that count as a share of the group. From our study:
- Gender: 92 patients (46%) were female
- Smoking status: 64 patients (32%) currently smoked
- Diabetes prevalence: 78 patients (39%) had diabetes
- Disease stage: 120 patients (60%) had stage I disease
Mean vs Median in Medical Research: Which Should You Use?
Look at the shape of your data. Values spread evenly around the center? Use the mean. A few extreme values dragging things to one side? Go with the median.
| Feature | Mean | Median |
| Definition | Arithmetic average | Middle observation |
| Best suited for | Approximately symmetric data | Skewed data |
| Effect of outliers | More sensitive | Less sensitive |
| Reporting | Mean (SD) | Median (IQR) |
Consider hospital length of stay. The vast majority of patients in our study have a hospital stay of less than a week, with some being discharged after more than a month. Those long admissions may be skewing the mean up to 6.8 days, but the median remains 4 days and that’s much closer to what a typical patient experienced. Before deciding, look at a histogram, as one number may hide skew.
Understanding descriptive statistics is an important first step in medical data analysis. Researchers should also become familiar with other essential statistical concepts, including standard deviation, probability, hypothesis testing, and interpreting clinical study results. For a broader introduction, explore our guide to medical statistics for beginners and learn how these concepts apply to clinical research.
Standard Deviation vs Standard Error in Medical Research
These are all mixed up but they have different questions
- Standard deviation (SD): How spread out are the individual patients?
- The standard error (SE) is the degree of accuracy for using the sample mean to estimate the population mean.
One formula connects them: SE = SD ÷ √n.
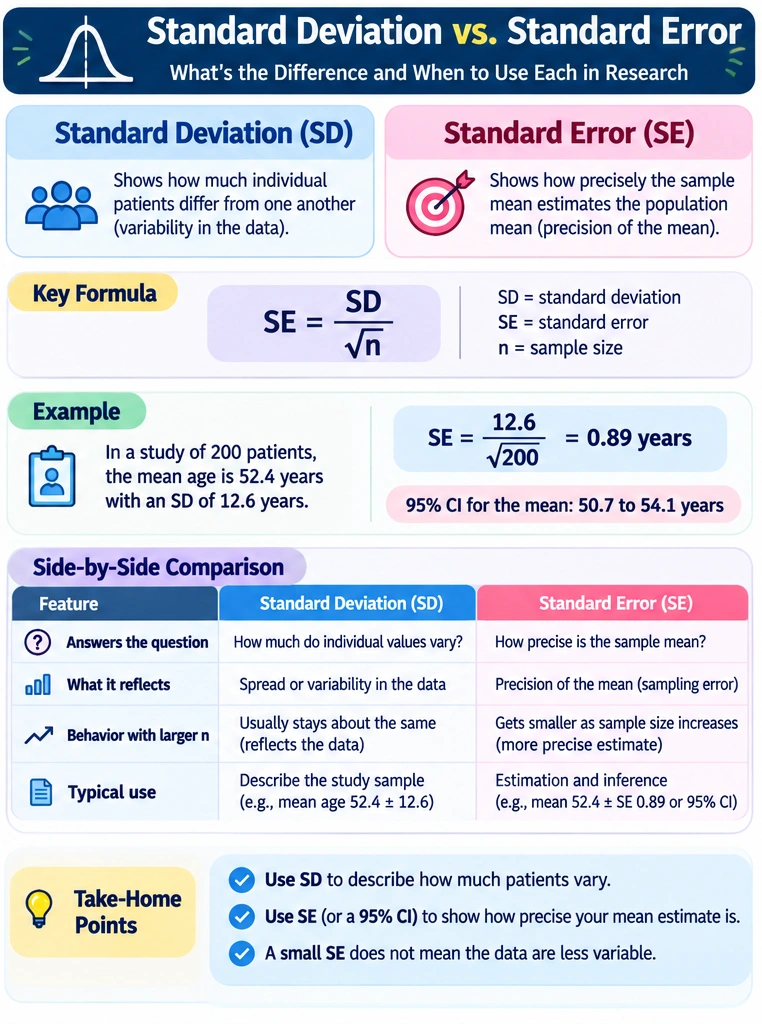
In our study, mean age is 52.4 years with an SD of 12.6, so the SE is 12.6 ÷ √200, or 0.89 years.
Don’t read that small SE as proof that patients were close in age. The SD says they weren’t. SE shrinks as the sample grows, so swapping it in for SD makes your data look tidier than they are.
Describing how much patients varied? Use the SD. Showing how precise an estimate is? Use the SE or a 95% confidence interval (here, 50.7 to 54.1 years).
Understanding Interquartile Range (IQR) and Skewness
What Is the Interquartile Range?
Line your values up from lowest to highest. Q1 is the 25th percentile and Q3 is the 75th.
IQR = Q3 − Q1
That gap holds the middle 50% of observations, which is why extreme values barely move it. Papers often show both quartiles, like a median stay of 4 days (IQR 3 to 7).
What Is Skewness in Clinical Data?
Skewness just means the distribution is lopsided.
- Positive (right) skew has a long tail of high values. Hospital stay and C-reactive protein often look like this.
- Negative (left) skew has a long tail of low values, as with age at diagnosis for a disease of older adults.
- Roughly symmetric data spread about equally on both sides. Adult height is a good example.
How to Present Descriptive Statistics in aTable 1
Table 1 is usually the first table in a clinical paper. It lists participants’ baseline characteristics, or what they looked like when the study began. Readers check it to decide whether the results might apply to their own patients.
Here’s how to create Table 1 in medical research:
- Start with demographic variables and follow with clinical ones.
- Put the number of participants in the column heading.
- Add units where they apply.
- Stick to the same number of decimal places.
| Characteristic | Study population (N=200) |
| Age, years, mean (SD) | 52.4 (12.6) |
| Female, n (%) | 92 (46%) |
| BMI, kg/m², median (IQR) | 26.5 (23 to 30) |
| Diabetes, n (%) | 78 (39%) |
| Hypertension, n (%) | 110 (55%) |
Illustrative data only.
Descriptive statistics for baseline characteristics follow an easy pattern:
- Approximately symmetric continuous variables: mean (SD)
- Skewed continuous variables: median (IQR)
- Categorical variables: n (%)
A few more things to get right:
- Account for missing data. If 15 patients had no BMI recorded, show n=185 for that row.
- Skip repeating the whole table in your results text. Pick out what matters.
- Avoid P values for baseline comparisons in randomized clinical trials. With proper randomization, any baseline differences are due to chance, so these tests tell readers very little.
How to Perform Descriptive Statistical Analysis Using SPSS
You can get through descriptive data analysis using SPSS in six steps:
- Import your dataset. Go to File > Import Data and pick your Excel or CSV file.
- Define your variables. In Variable View, add names and labels, then mark each measure as Scale, Ordinal, or Nominal.
- Run continuous variables. Go to Analyze > Descriptive Statistics > Descriptives, then move age and other numerical variables into the list.
- Run categorical variables. Go to Analyze > Descriptive Statistics > Frequencies, then add variables like diabetes status.
- Check distributions. Analyze > Descriptive Statistics > Explore gives you the median, IQR, skewness, and plots.
- Read the output. Compare the mean and median, then look at the histogram. Skewed data? Report median (IQR). In Frequencies, Valid Percent leaves out missing values and Percent keeps them in. A diabetes frequency of 78 with no missing data becomes 78 (39%).
| SPSS procedure | Main purpose |
| Descriptives | Mean, SD, minimum, maximum |
| Frequencies | Counts, percentages, mode |
| Explore | Median, quartiles, IQR, distribution plots |
One catch: Descriptives won’t give you the median or mode, so use Frequencies or Explore for those. Explore also shows the IQR as a single number. To get Q1 and Q3 for your table, click Statistics and tick Percentiles.
Biostatistics Training
Knowing which statistic to report matters more than simply knowing how to calculate it.
Learn to interpret clinical data, choose appropriate statistical methods, understand probability distributions, and apply inferential statistics and regression analysis. Build the biostatistics foundation needed to conduct and report stronger medical research.
Common Mistakes in Reporting Descriptive Statistics
These errors keep showing up when reporting descriptive statistics in medical research:
- Giving mean and SD for badly skewed data without looking at the distribution
- Using SE where you should use SD to describe patient-level variability
- Giving percentages with no frequencies or denominators. “39%” means little until readers know it’s 78 of 200 patients.
- Leaving out missing observations, so readers can’t tell which patients your percentages include
- Using too many decimals or mixing formats. An age of 52.4 years is precise enough, and 52.387 adds nothing.
A neat table won’t save you if the numbers don’t match the data you collected.
Descriptive Statistics vs. Inferential Statistics
Descriptive statistics summarize your sample. Inferential statistics use that sample to say something about a larger population.
| Descriptive statistics | Inferential statistics |
| Summarizes collected data | Draws conclusions about a population |
| Describes patient characteristics | Tests hypotheses |
| Uses mean, median, SD, IQR, and percentages | Uses t-tests, ANOVA, regression, and other tests |
| Commonly used in Table 1 | Commonly used in comparative analyses |
Nearly every clinical study needs descriptive statistics. Whether you also need inferential statistics comes down to your research question and study design. In our study, “39% of patients had diabetes” is descriptive. Testing whether hospital stay differs between patients with and without diabetes is inferential.
Frequently Asked Questions About Descriptive Statistics
Q1. What is the meaning of descriptive statistics in medical research?
They are ways to describe clinical information, including patient demographics, lab values and disease characteristics.
Q2. What are the descriptive statistics in clinical research?
You will see the mean and median, the SD, range, IQR, frequencies and percentages the majority of the time.
Q3. Under which circumstances should researchers use mean vs. median?
When continuous data are reasonably symmetric use mean with SD, when data is skewed, use median with IQR.
Q4. What is the difference between SD and SE?
The SD provides information about how spread out individual observations are. SE indicates how close the sample statistic (typically the mean) is to the population value.
Q5. In clinical research, what is the name of table 1?
It’s the table that shows the baseline demographic and clinical data of the study population.
Q6. Is it possible to perform descriptive statistics with SPSS?
Yes. Most of the information clinical researchers need is included in the Descriptives, Frequencies and Explore.
Conclusion
Descriptive statistics in medical research present a picture to readers of what you researched and what you found. Match each measure to the type of variable and distribution of data and review your reporting according to the SAMPL guidelines before submission.
Looking to further develop your research skills? Next, you should turn to the American Academy of Research and Academics (AARA), which publishes guides on research methods and statistics, such as meta-analysis and systematic reviews.
Advance Your Research Skills
Turn Statistical Concepts Into Confident Research Decisions
Descriptive statistics are only one part of medical data analysis. Develop a stronger understanding of statistical methods, clinical data interpretation, hypothesis testing, and regression analysis with AARA’s Biostatistics Online Course.
Explore the Biostatistics Course →Disclaimer:
Articles published by American Academy of Research & Academics are prepared by our team using information from direct experience, publicly available resources, and educational references. AI tools may be used to assist with drafting, proofreading, and formatting; however, all content undergoes review and approval before publication.
The information provided is intended for educational purposes only. Requirements, policies, and processes may change over time. Readers should consult official sources for the most current information.