
Introduction: Why Do Sensitivity and Specificity Matter?
Say a test is advertised as 95% accurate, and it comes back positive. Does that mean you have a 95% chance of being sick? Most people would say yes because it feels obvious. In many real situations, though, the true figure is much lower, and the gap can be surprising.
What’s going on is that two separate questions get mashed together. Sensitivity and specificity come out of studies where the researchers already knew who was sick, so they tell you about the test. PPV and NPV flip it around. They start from the result a patient is actually holding and ask what it means for that person, and the answer moves a lot depending on how common the disease is in the first place (its prevalence).
I’ll go through these medical statistics concepts in the order I’d explain them to a friend studying for exams: sensitivity and specificity, then false positives and false negatives, then predictive values and likelihood ratios. If you can add and divide, you can follow all of it.
What Are Sensitivity and Specificity?
Any diagnostic test is really being judged on two separate skills. Can it find the disease in people who have it? And can it leave healthy people alone? Sensitivity scores the first skill, specificity scores the second, and a test can be great at one while being fairly mediocre at the other.
Sensitivity Definition
Sensitivity is the proportion of people with the disease who test positive.
Say we’ve got 100 kids, and a throat culture has already confirmed strep in every one of them. We run a rapid strep test on all 100, and it comes back positive in 85. That’s a sensitivity of 85%, and it also means 15 kids with strep were sent home with a negative result.
Sensitivity = TP / (TP + FN) × 100
When sensitivity is high, the test hardly ever misses, so a negative result actually means something. Most of us learned this as “SnNout”: a Sensitive test that comes back Negative helps rule the disease out.
I’d add one warning, though, because students lean on SnNout harder than they should. If the patient in front of you looks exactly like the textbook picture, a single negative test isn’t a reason to stop looking. How likely the disease was before you tested (the pretest probability) still counts for a lot.
Specificity Definition
Specificity is the proportion of people without the disease who test negative.
Same clinic, different kids. These 100 have sore throats from a virus, with no strep at all. The rapid test comes back negative for 97 of them, so specificity is 97%, and the other 3 would probably end up on antibiotics they didn’t need.
Specificity = TN / (TN + FP) × 100
A test with high specificity rarely calls a healthy person sick. So if it does come back positive, you should take that seriously. The matching mnemonic is “SpPin”: a Positive Specific test helps rule the disease in.
Sensitivity and Specificity Formula: The 2×2 Table
Honestly, if you only remember one thing from this whole article, make it this table. Nearly every number in diagnostic testing gets calculated from it. Medical books call it the 2×2 table, and in statistics and machine learning you’ll see it called a confusion matrix, which is a slightly funny name for something this simple.
| Disease Present | Disease Absent | |
| Test Positive | True Positive (TP) | False Positive (FP) |
| Test Negative | False Negative (FN) | True Negative (TN) |
Columns are the truth (does the person really have the disease?). Rows are what the test said. Everyone you test ends up in one box and only one.
True Positive
Sick patient, positive test. Nothing to fix.
True Negative
No disease and a negative result, so the test got this one right as well.
False Positive
A healthy person gets told they might be sick. In real life, that can mean an extra scan, maybe a biopsy, and a week of worrying before anyone says it was nothing.
False Negative
This is the box that keeps clinicians up at night. The patient has the disease, the test says they don’t, and they may go home without the treatment they needed.
Once the four boxes are filled in, the formulas pretty much write themselves:
- Sensitivity = TP / (TP + FN)
- Specificity = TN / (TN + FP)
- False-positive rate = FP / (FP + TN), which is the same as 1 − specificity
- False-negative rate = FN / (FN + TP), which is the same as 1 − sensitivity
Quick sanity check for exams: sensitivity and the false-negative rate should always add up to 100%, and the same goes for specificity and the false-positive rate. If yours come out to something else, a number landed in the wrong box.
Sensitivity and Specificity Example
Let’s put some numbers on it. These are made up, but they keep the math easy.
We start with 100 patients who definitely have the disease. The new test is positive for 90 of them and misses 10, so we’ve got 90 true positives and 10 false negatives.
Sensitivity = 90 / (90 + 10) = 90%
Then we test 100 people who definitely don’t have it. The test says negative for 95, but 5 get a positive result they didn’t deserve. That’s 95 true negatives and 5 false positives.
Specificity = 95 / (95 + 5) = 95%
So the test catches 9 of every 10 sick patients and correctly clears 19 of every 20 healthy people. Put the other way around, it misses 10% of cases and raises a false alarm 5% of the time.
American Academy of Research & Academics
Make sense of the numbers behind diagnostic tests.
Sensitivity and specificity are just the beginning. Build your skills in probability, data analysis, and interpreting research results with AARA’s Biostatistics Online Course.
How to Interpret Sensitivity and Specificity
When you run into these numbers in a paper or on an exam, this is the quick way to read them:
| Result | What it tells you |
| High sensitivity | Few false negatives |
| Low sensitivity | More false negatives |
| High specificity | Few false positives |
| Low specificity | More false positives |
For our test, that means it’s a bit better at avoiding false alarms (95%) than at avoiding missed cases (90%). In a published study, you should also check the confidence intervals to understand how precise those estimates are.
Sensitivity vs Specificity: What’s the Difference?
Side by side, they look like this:
| Sensitivity | Specificity |
| Identifies people with disease | Identifies people without disease |
| Based on TP and FN | Based on TN and FP |
| Higher sensitivity → fewer false negatives | Higher specificity → fewer false positives |
| Matters most when missing disease is a problem | Matters most when false alarms are a problem |
The annoying part is that you usually can’t have both at 100%. A lot of tests give you a number, like a troponin level or a blood glucose reading, and somebody has to decide where “normal” stops and “positive” starts. That dividing line is the diagnostic threshold, also called the cutoff value.
Drop the cutoff and the test catches more real cases, so sensitivity goes up. But more healthy people get pulled over the line too, so specificity goes down. Push the cutoff up, and you get the reverse. That tug-of-war is basically what an ROC curve draws, and we’ll get to it in a bit.
What Is a Good Sensitivity and Specificity?
I get why people want a single number here, something like “above 90% is good.” It would make life easier. It just doesn’t exist, because a figure that’s perfectly fine for one test can be dangerous for another.
Whether a test is good enough really comes down to the situation. How serious is the disease? What happens to someone whose case gets missed, and what happens to a healthy person who’s wrongly told they have it? Is the test being used to screen people or to confirm a diagnosis, and how common is the disease in the group you’re testing?
Screening Tests
When you screen, you’re usually testing lots of people who feel fine, and the worst outcome is letting a real case slip by. So screening tests tend to favor high sensitivity. Some healthy people will screen positive, and that’s accepted, because follow-up testing sorts them out.
Confirmatory Tests
Confirmatory tests come next, after someone has screened positive. Now the worry flips. You don’t want to label someone with a disease and start treatment unless you’re sure, so these tests lean toward high specificity.
So rather than asking whether 85% is good, ask good for what, and for which patients.
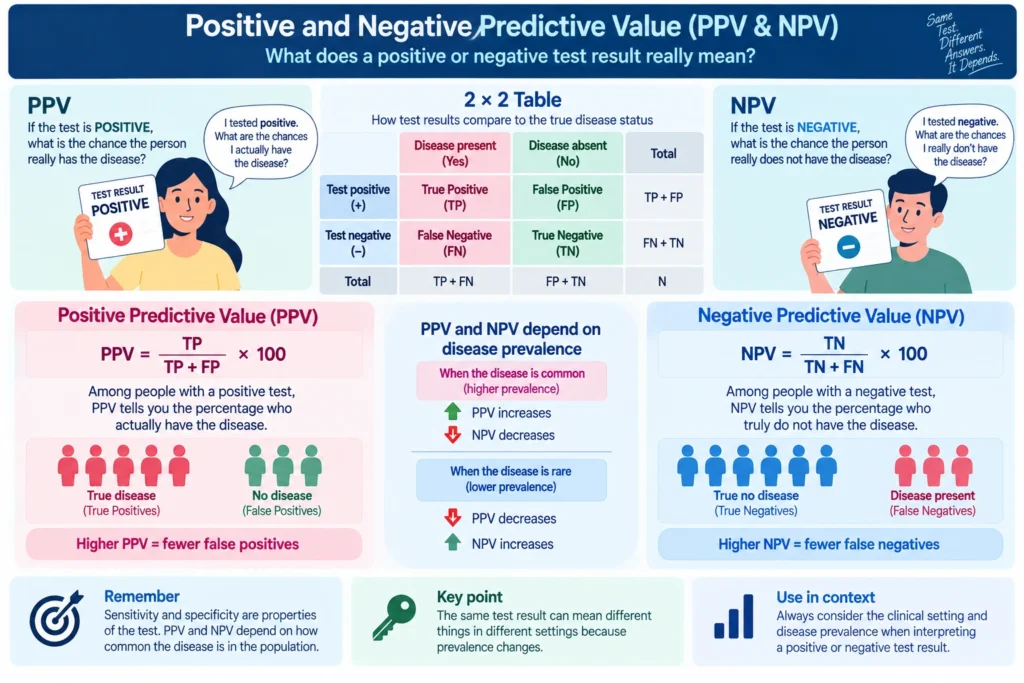
Sensitivity and Specificity vs PPV and NPV
Sensitivity and specificity are about the test. PPV and NPV are about the patient’s result, and if a patient has ever asked you “so does this mean I have it?”, that’s the question they answer.
Positive Predictive Value (PPV)
PPV = TP / (TP + FP)
Out of everyone who tested positive, how many really have the disease?
Negative Predictive Value (NPV)
NPV = TN / (TN + FN)
Out of everyone who tested negative, how many really don’t?
If you keep mixing these up, go back to the 2×2 table. Sensitivity and specificity are calculated down the columns, so they start from who’s actually sick. PPV and NPV go across the rows, so they start from what the test said.
Why Disease Prevalence Matters
Prevalence just means how common the disease is in the group you’re testing. It sounds like a side detail, but it changes PPV and NPV a lot. Researchers often use cross-sectional studies to estimate how common a condition is in a population at a particular point in time.
Take our same test, with 90% sensitivity and 95% specificity, and use it on 1,000 people in a place where only 1% have the disease. That’s 10 sick people, and the test finds 9 of them. The other 990 are healthy, but with a 5% false-positive rate, about 50 of them test positive anyway.
So there are 59 positive results, and only 9 of them are real. PPV ≈ 9 / 59 ≈ 15%.
That’s the answer to the question at the top of this article. When a disease is rare, most of the positives from a perfectly decent test can be wrong. The test didn’t change at all; the people being tested did.
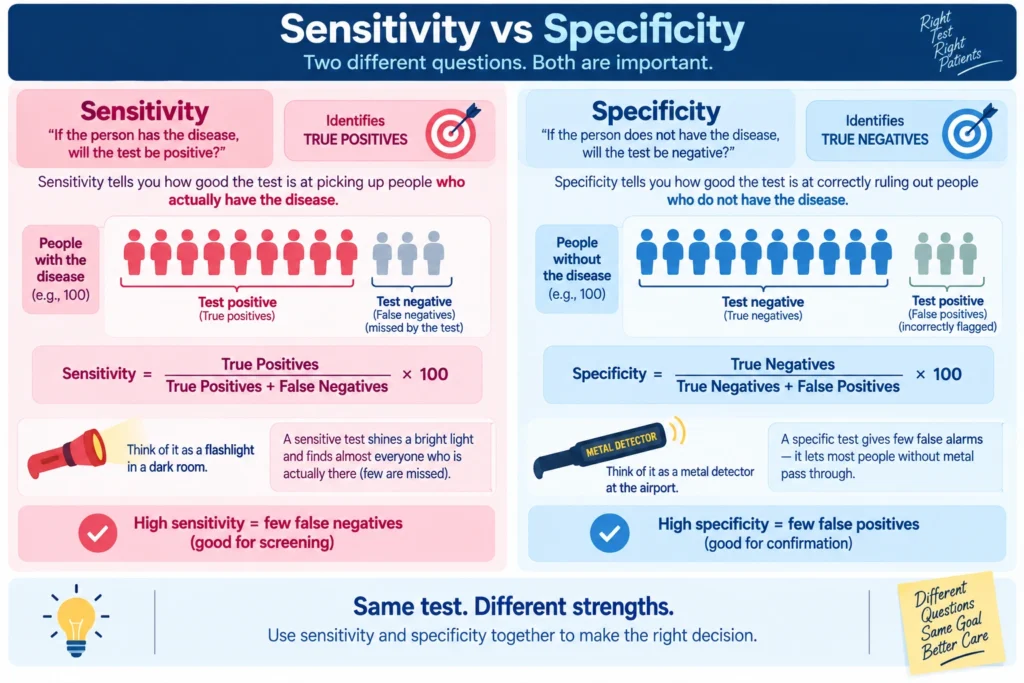
Likelihood Ratios: Connecting Pretest and Posttest Probability
Likelihood ratios squeeze sensitivity and specificity into one number that tells you how far a result should move your thinking.
Positive likelihood ratio (LR+)
LR+ = Sensitivity / (1 − Specificity)
Negative likelihood ratio (LR−)
LR− = (1 − Sensitivity) / Specificity
A positive result pushes the odds of disease up by a factor of LR+, and a negative result pulls them down by a factor of LR−. For our example test, LR+ works out to 0.90 / 0.05 = 18, and LR− to 0.10 / 0.95, which is about 0.11.
You can’t use them in a vacuum, though. You need a starting point, the pretest probability, which is basically your honest guess about how likely the disease is before the test. It’s based on the symptoms, the history, the exam, and how common the condition is where you work. From there, it goes:
Pretest probability → diagnostic test → posttest probability
This is Bayes’ theorem doing its job. Turn the pretest probability into odds, multiply by the likelihood ratio to get the posttest odds, then turn that back into a probability. It sounds like more work than it is, and after a few practice questions you’ll do it without thinking.
Quick Rule of Thumb
A lot of clinicians carry around two rough numbers. An LR+ above 10 is usually strong evidence for the disease, and an LR− below 0.1 is usually strong evidence against it.
Just don’t treat them as hard cutoffs. If the pretest probability was tiny, even a big LR+ might not get you anywhere near a diagnosis.
ROC Curve and Area Under the Curve (AUC)
One sensitivity and one specificity only describe the test at a single cutoff. Plenty of tests could use dozens of different cutoffs, and looking at them one at a time gets tedious fast. The ROC curve puts them all on one graph.
What Is an ROC Curve?
ROC stands for receiver operating characteristic, a name left over from radar research during World War II. The curve plots sensitivity on the y-axis against the false-positive rate (1 − specificity) on the x-axis, and every point on it is one diagnostic threshold.
Move toward the lower cutoffs and you pick up more true cases, but the false positives climb too. Move toward the higher ones and false positives drop, but you start missing people. Seeing the whole curve lets you compare every cutoff at a glance.
What you’re hoping to see is a curve that shoots up early and hugs the top-left corner. That shape means the test finds most cases without raising many false alarms.
What Is AUC?
AUC is the area under that curve. It’s a single number that sums up how well the test tells people with the condition apart from people without it, across all the thresholds.
An AUC of 1.0 is perfect separation. Around 0.5, the test is doing about as well as flipping a coin.
A high AUC is nice to see, but it isn’t proof that a test is useful in practice. The test can still do poorly at the cutoff a hospital actually picks, or in patients who don’t look like the ones in the study.
Youden Index: Choosing a Diagnostic Cutoff
If you’re doing a diagnostic accuracy study yourself, at some point a reviewer (or your supervisor) will ask which cutoff you recommend. The Youden index is where most people start.
Youden Index (J) = Sensitivity + Specificity − 1
You calculate J for each threshold. It runs from 0, which is no better than chance, up to 1, which is perfect. For our example test, J = 0.90 + 0.95 − 1 = 0.85. Whichever threshold gives the highest J is usually reported as the best balance between sensitivity and specificity.
Keep in mind, though, that the best cutoff on paper isn’t always the best cutoff for patients. If missing the disease could kill someone, it can make sense to choose a lower cutoff with better sensitivity, even though J comes out a little lower.
Reference Standard and Diagnostic Accuracy
None of these numbers can be calculated unless you know who actually has the disease. That’s the job of the reference standard, the best method available for confirming the diagnosis. People often call it the gold standard, even when it isn’t perfect.
Diagnostic accuracy is simply how well the index test (the new test being studied) agrees with that reference standard.
When you read a diagnostic accuracy paper, I’d look for five things to be spelled out clearly: the target population, the index test, the reference standard, the threshold, and how the disease was defined. If any of those are vague, trust the numbers a little less.
Also check who got enrolled. A study that pits very sick patients against obviously healthy volunteers will make almost any test look good, because real clinics are full of mild, early, and borderline cases. It’s one more reason not to read sensitivity and specificity in isolation. A structured risk of bias assessment helps you examine how patient selection and testing methods could have influenced the reported results.
American Academy of Research & Academics
Read diagnostic studies with a more critical eye.
Strengthen your understanding of study design, bias, and data interpretation with AARA’s Basic Research Methodology course, and learn to evaluate the evidence behind the numbers.
Sensitivity and Specificity Example Questions
Try these before peeking at the answers. Questions like these show up on exams all the time, usually with slightly uglier numbers.
Example Question 1: A test correctly identifies 90 of 100 patients who have the disease. What is its sensitivity?
Answer: 90 / 100 = 90%
Example Question 2: Among 200 people without the disease, 180 test negative. What is the specificity?
Answer: 180 / 200 = 90%
Example Question 3: A test has 95% sensitivity. What is its false-negative rate?
Answer: 100% − 95% = 5%
Example Question 4: A test has 90% specificity. What is its false-positive rate?
Answer: 100% − 90% = 10%
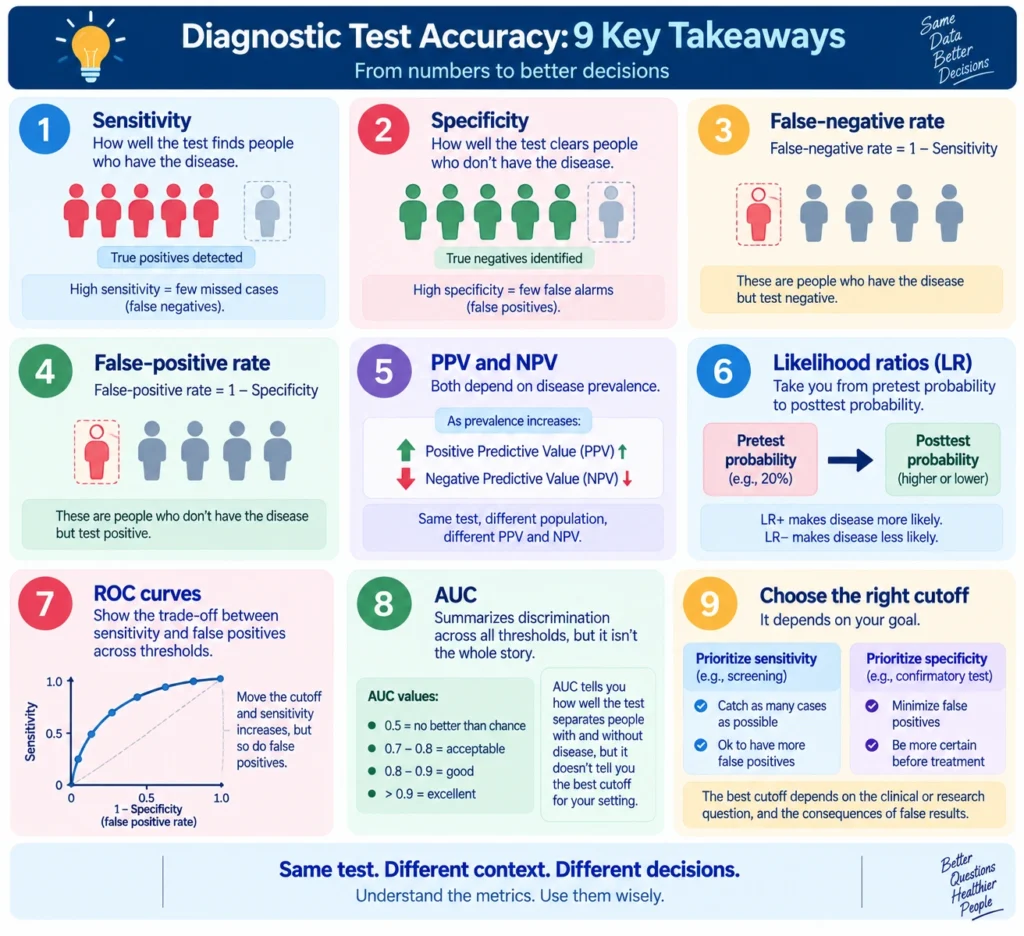
Sensitivity and Specificity: Key Takeaways
Final Thoughts
Once you grab the concepts of sensitivity and specificity, the rest of diagnostic statistics feels a lot less intimidating. Still, reading a real diagnostic study, or designing your own, takes practice with predictive values, likelihood ratios, ROC curves, and study design. If you’d like guided help with that, the American Academy of Research and Academics (AARA) offers research methodology and biostatistics support for medical students, doctors, and early-career researchers. Whether you’re planning a diagnostic accuracy study, a systematic review, or a meta-analysis, AARA can help you go from memorizing formulas to actually using them in your own research.
American Academy of Research & Academics
Ready to take your research question further?
Thinking about your own diagnostic accuracy study? Explore AARA’s research mentorship for guidance on refining your question, planning your study, and preparing a manuscript.
Frequently Asked Questions
Q1. What is sensitivity in medical statistics?
Sensitivity is the percentage of people who have a disease and test positive for it. A highly sensitive test misses very few cases.
Q2. What is specificity in medical statistics?
Specificity is the percentage of people who don’t have a disease and test negative. A highly specific test gives very few false alarms.
Q3. What is the difference between sensitivity and specificity?
Sensitivity is about the sick group and tells you about false negatives. Specificity is about the healthy group and tells you about false positives.
Q4. Is high sensitivity or high specificity better?
It depends on the situation. If missing the disease is dangerous, sensitivity matters more. If a wrong diagnosis would cause real harm, specificity matters more.
Q5. How does prevalence affect PPV and NPV?
As a disease becomes more common, PPV goes up and NPV goes down. When it’s rare, a bigger share of positive results turn out to be false positives.
Q6. What is the difference between sensitivity, specificity, and accuracy?
Accuracy is the share of all correct results: (TP + TN) / total. It can look impressive simply because most people tested are healthy, which is why sensitivity and specificity usually tell you more.
Disclaimer:
Articles published by American Academy of Research & Academics are prepared by our team using information from direct experience, publicly available resources, and educational references. AI tools may be used to assist with drafting, proofreading, and formatting; however, all content undergoes review and approval before publication.
The information provided is intended for educational purposes only. Requirements, policies, and processes may change over time. Readers should consult official sources for the most current information.