
Introduction
Say you have identified 200 patients with a particular disease. You want to know whether an earlier exposure, maybe smoking, a medication, an infection, or something in their workplace, is linked to that disease. Finding the patients is the easy part. The harder question is who you compare them with.
In a case-control study, the quality of your controls can make or break the study.
The vocabulary is short:
- Cases: participants who have the outcome
- Controls: participants who do not have the outcome
- Exposure: the factor you are investigating
- Outcome: the disease or condition of interest
You start with the outcome and then look backwards at exposure. The association is usually reported as an odds ratio (OR). This design is especially useful for uncommon outcomes, and it is generally faster and less expensive than following a cohort forward in time.
What Is a Case-Control Study?
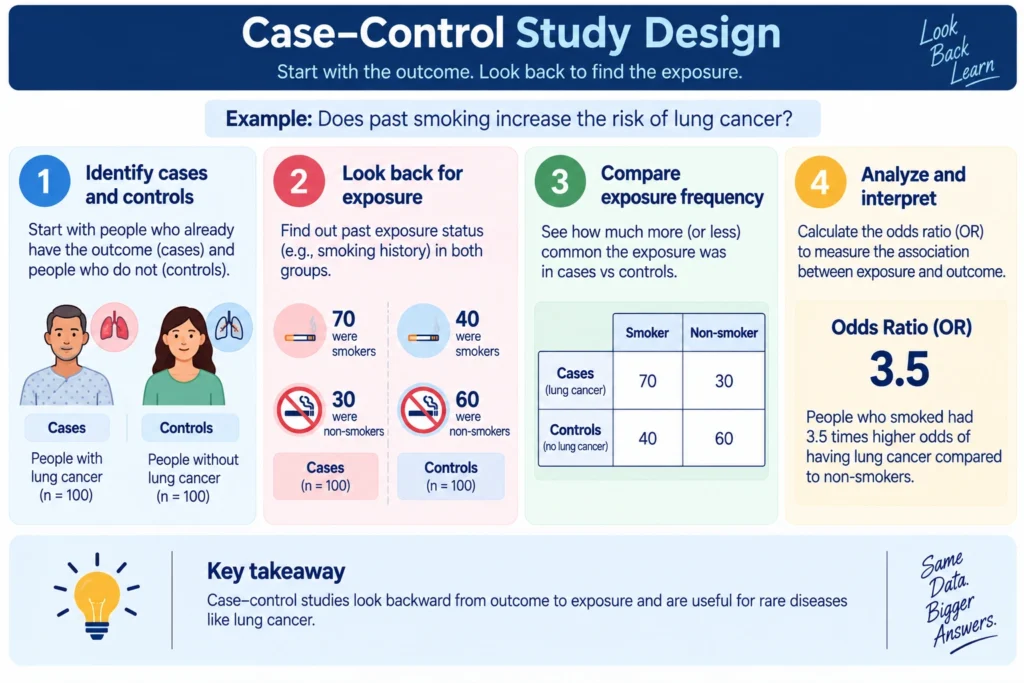
A case-control study is an observational study that begins by identifying participants with an outcome (cases) and without the outcome (controls), then compares previous exposure to see whether the exposure is associated with the outcome.
The sequence is simple to remember:
Start with the outcome → identify cases and controls → look backward for exposure.
| Group | Outcome | Exposure assessed? |
| Cases | Present | Yes |
| Controls | Absent | Yes |
Every case-control study is really asking one question: were cases more likely than controls to have been exposed to the suspected risk factor?
That is what separates it from a cohort study. It helps to see the two side by side, because the case-control vs cohort study distinction is where most beginners get stuck.
| Case-control | Cohort |
| Starts with the outcome | Starts with the exposure |
| Looks backward for exposure | Follows participants forward for the outcome |
| Usually estimates an odds ratio | Can directly estimate risk or rate measures |
| Efficient for rare outcomes | Useful for studying multiple outcomes |
Neither design is better in the abstract. The right one depends on how common your outcome is, how much time you have, and what you can realistically measure.
The third observational design sits alongside both. Cross sectional study design in medical research covers what a snapshot can and cannot establish, and why it never supports a causal claim.
How to Select Cases and Controls in a Case-Control Study
This is where your study is won or lost, and it happens before you collect a single participant.
Step 1: Define your cases clearly
A vague case definition weakens everything downstream. Write down, in advance:
- The diagnostic criteria you will use, ideally standardized or validated
- Inclusion and exclusion criteria
- Whether you are including incident cases (newly diagnosed) or prevalent cases (anyone living with the condition)
Incident and prevalent cases are not interchangeable. Prevalent cases are survivors, so they may differ from people who died early or recovered quickly, and that can distort the exposure you measure.
Where your case definition comes from matters too. How to do a retrospective chart review covers building a case definition from existing records, which is how most IMG led case-control studies actually start.
This is not just a methods point. The Newcastle-Ottawa Scale, which reviewers use to grade case-control studies, specifically assesses how adequately the case definition was made and how representative the cases are.
Step 2: Define the source population
Ask yourself one question:
From what population could both my cases and my controls have arisen?
That population is your source population, sometimes called the study base. Your cases came out of it, and your controls should come out of the same place.
CDC guidance makes this the heart of control selection: controls should represent the source population that produced the cases, so that they give you a fair picture of how common the exposure is in that population.
If your cases come from a tertiary kidney center that receives referrals from four provinces, then controls recruited from one neighborhood near the hospital are not drawn from the same base.
Step 3: Select controls independently of exposure
Do not select controls because they are unexposed.
Controls are chosen on eligibility and source population alone. The moment you pick people partly because they did not smoke, did not take the drug, or did not have the infection, you have built the result into the design. That is selection bias, and no amount of statistical adjustment later will fix it.
A useful habit: decide your control eligibility criteria and write them down before you know anyone’s exposure status.
Writing them down means writing them into the protocol, before ethics review. How to get IRB approval for research covers what the eligibility section needs to contain and why boards send vague ones back.
Research Methodology
No amount of statistical adjustment later will fix a design decision made badly.
Case definition, source population, eligibility criteria written before you know anyone’s exposure. These get decided in week one and they determine whether the study is salvageable in month nine. Learn to make them deliberately rather than by default.
How to Select Controls for a Case-Control Study
Once you know your source population, you have to choose where the controls will physically come from. Each option has a trade-off.
Community controls
Controls are recruited from the general community, for example through neighborhood sampling or random digit dialing. This suits studies where cases are drawn from a defined geographic area, and you want controls to reflect the general population. The downsides are cost, time, and lower participation rates.
Hospital controls
Controls are patients admitted or seen for a different condition. They are convenient, easier to interview, and their records are as detailed as those of your cases, which helps with comparability of exposure measurement. The concern is that hospital patients are not the general population. If their admitting conditions are also related to your exposure, for example, recruiting respiratory patients as controls in a smoking study, the exposure in your control group will be too high, and the odds ratio will be pulled toward 1.
Population-based controls
Controls are sampled from a defined population register, insurance list, or electoral roll covering the same area and time period as the cases. This is the cleanest fit with the source population idea, and it works well where reliable registries exist.
Multiple controls per case
When cases are limited, which is common for rare diseases, you can recruit more than one control per case: 1:1, 1:2, 1:3, or 1:4.
More controls give you more statistical precision, but the returns shrink quickly. The jump from 1:1 to 1:2 buys you a lot. Going from 1:3 to 1:4 buys you very little, while the cost and workload keep rising. Most studies stop at around 1:4.
How much precision you actually gain is calculable rather than a matter of convention. Sample size calculation for clinical research covers how the control to case ratio feeds into power.
For your research protocol, state:
- Where controls come from
- Why that source matches your cases
- Your control-to-case ratio and the reason for it
- Eligibility criteria, written independently of exposure
Matching in Case-Control Studies Explained
Matching does not automatically eliminate confounding. The BMJ flags this as one of the most common misconceptions about case-control studies. Matching is a sampling strategy. It can make your study more efficient, but it changes both the design and the analysis, and it does not remove confounding on its own.
Types of matching in case-control studies
1. Individual matching
Each case is paired with one or more controls who share specified characteristics. A 55-year-old male case is matched with a control of similar age and the same sex. This creates matched sets that must be respected in the analysis.
2. Frequency matching
Instead of pairing people one by one, you make the overall distribution of a characteristic similar in both groups. If 30% of your cases are women aged 40 to 49, you recruit controls so that roughly 30% of them fall in that same category. STROBE recognizes both individual and frequency matching as standard forms.
What variables should you match on?
Common matching variables include:
- Age
- Sex
- Geographic area
- Healthcare facility
- Calendar time
But be selective.
Don’t automatically match on every available variable.
Every extra matching variable makes it harder to find an eligible control, slows recruitment, and can complicate the analysis. Matching on too many factors, or on factors closely tied to the exposure, is called overmatching, and it can reduce the efficiency of your study. CDC guidance specifically warns against matching on the exposure of interest or on characteristics you actually want to study, because once matched, a variable can no longer be examined as a risk factor.
Matching and Logistic Regression: What Analysis Should You Use?
Matching is a design decision with a statistical consequence, so plan the analysis at the same time.
Unmatched case-control study: Ordinary (unconditional) logistic regression is commonly used, with confounders entered as covariates.
Individually matched study: Conditional logistic regression may be appropriate, because it compares exposure within each matched set rather than across the whole sample.
Frequency-matched study: The analysis has to account for the matching variables, usually by adjusting for them in the model, since matching was done at the group level rather than person by person.
Many beginner resources compress all of this into one line: “if you matched, use conditional logistic regression.” That is where they go wrong. The right model depends on how the matching was actually performed and how the controls were sampled, so describe your matching precisely in your methods and choose the model to fit it.
Model choice follows design in every study, not just matched ones. Which statistical test to use in medical research covers the four questions that decide it.
Odds Ratio in Case-Control Studies
Because you started with the outcome, you cannot calculate incidence directly. What you can do is compare the odds of exposure in the two groups.
Start with the 2 × 2 table:
| Exposed | Not exposed | |
| Cases | a | b |
| Controls | c | d |
Odds Ratio = (a × d) / (b × c)
In plain English, the odds ratio compares the odds of having been exposed among cases with the odds of having been exposed among controls.
How to interpret the odds ratio
| OR | Interpretation |
| OR = 1 | No association between exposure and outcome |
| OR > 1 | Higher odds of exposure among cases |
| OR < 1 | Lower odds of exposure among cases |
Always report the confidence interval alongside the estimate. An OR of 2.4 with a 95% CI of 0.8 to 7.1 tells a very different story from an OR of 2.4 with a CI of 1.9 to 3.0.
That difference is precision, not significance, and the two get conflated constantly. P value versus confidence interval covers what each one tells you and why journals expect both.
Two nuances worth knowing:
An OR is not a risk ratio. They are close when the outcome is rare, but they are different measures, and the odds ratio is always further from 1. Writing “cases were 2.4 times more likely to develop the disease” when you calculated an OR is a common and avoidable error.
The OR is not automatically the answer in every case-control design. What your estimate actually represents depends on how the controls were sampled. Under incidence-density sampling, for example, the estimate approximates an incidence rate ratio rather than a simple odds ratio. So describe your sampling method, then name your effect estimate accordingly.
Biostatistics
An odds ratio is not a risk ratio, and the software will not tell you which one you have.
Conditional versus unconditional logistic regression, what your sampling method means for the estimate, why the interval matters more than the point. Learn what sits underneath the output and you can name your effect measure correctly the first time.
Recall Bias and Selection Bias in Case-Control Studies
Defining these two biases is easy. Preventing them takes planning.
Recall bias
People who are sick think harder about the past. A mother of a child with a birth defect is likely to recall medications taken in pregnancy more thoroughly than a mother of a healthy child. That difference in remembering, not a real difference in exposure, can create a false association.
How to reduce recall bias:
- Use medical or administrative records instead of memory wherever possible
- Use standardized, structured questionnaires
- Use objective exposure measurements such as lab or pharmacy data
- Use the same exposure assessment method in both groups
- Blind interviewers to case or control status where feasible
These are the same features the Newcastle-Ottawa Scale looks for: whether exposure was ascertained from secure records or blinded structured interviews, and whether the same method was applied to cases and controls.
Selection bias
Instead of memorizing a definition, use this test:
Would this control have been eligible to become a case if they had developed the outcome?
If the answer is no, that control does not belong to your source population. Apply the question to your whole control group and most selection problems become visible immediately.
Nested Case-Control Study Explained
A nested case-control study is a case-control study conducted inside an existing cohort.
The difference is easier to see laid out:
Standard case-control: Population → identify cases and controls → look backward for exposure
Nested case-control: Existing cohort → cases develop over time → select controls from people still at risk at that moment → compare exposure
The key concept is risk-set sampling, also called incidence-density sampling. When a case occurs, you select controls from everyone in the cohort who is still under follow-up and still free of the outcome at that exact point in time. That moment is the index date.
Three things follow from this, and they surprise people at first:
- The same person can be selected as a control more than once, for different cases
- A person selected as a control can later develop the outcome and become a case
- Exposure data only need to be processed for the sampled participants, not the whole cohort
That last point is the practical payoff. If your exposure measurement is expensive, for example biomarker assays on stored blood samples, you can run them on a few hundred people instead of twenty thousand and still keep the timing structure of the cohort.
Nested Case-Control vs Case-Control Study
| Feature | Standard case-control | Nested case-control |
| Starting point | Cases identified independently | Existing cohort |
| Controls | Selected from source population | Selected from risk sets |
| Timing | Retrospective comparison | Preserves cohort timing |
| Data collection | Cases and controls | Sampled cohort participants |
| Major advantage | Efficient for rare outcomes | Efficient and preserves cohort structure |
| Common sampling approach | Various control sources | Incidence-density sampling |
Common Mistakes Young Researchers Make
1. Choosing controls because they are convenient: The ward next door is easy to access. That does not make it the right source population.
2. Matching on the exposure: If you match cases and controls on smoking, you can no longer study smoking.
3. Matching without planning the analysis: Matching changes which model you need. Decide both together, at protocol stage.
4. Treating matching as automatic confounding control: It isn’t. Matched variables still have to be handled in the analysis.
5. Calling every OR a risk ratio: They are different measures and should be reported with different wording.
6. Using ordinary logistic regression for every matched design: The appropriate model depends on the sampling and matching structure.
7. Forgetting to define the exposure time window: “Was the patient ever exposed?” is a much weaker question than “Was the patient exposed during the 12 months before the index date?”
8. Ignoring the index date: This matters in every design and becomes essential in nested case-control studies, where controls are sampled at a specific point in time.
Case-Control Study Design Checklist for Researchers
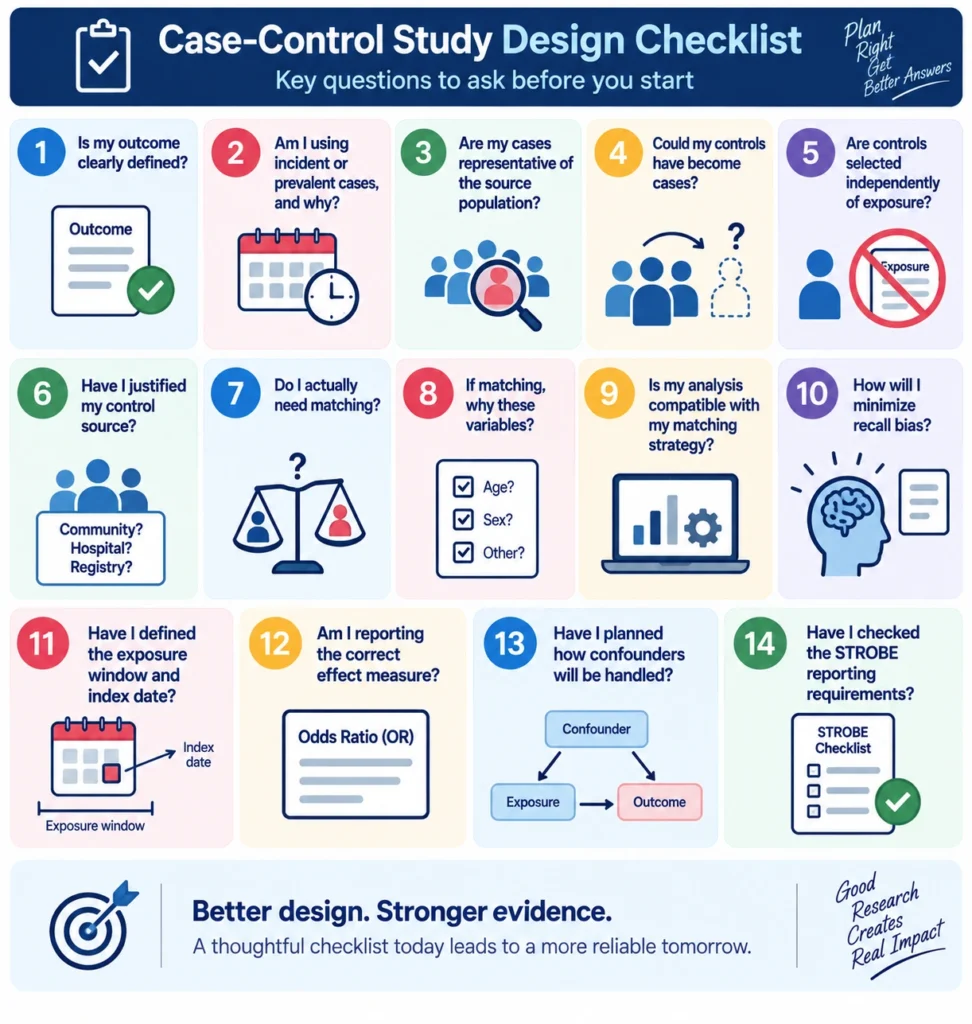
Before you collect data, work through this list:
How to Assess the Quality of a Case-Control Study
The Newcastle-Ottawa Scale (NOS) is the tool most commonly used to appraise case-control studies, and it grades three domains: selection, comparability, and exposure.
For case-control studies, it looks at how the case definition was made, whether cases are representative, how controls were selected and defined, whether cases and controls are comparable on important factors, how exposure was ascertained, whether the same method was used in both groups, and how non-response was handled.
If you are an IMG screening papers for a systematic review, these are exactly the questions to ask while you read. And if you are designing your own study, they are the questions your reviewers will ask you.
Systematic Review
Appraising other people’s case-control studies is the fastest way to learn to design your own.
Newcastle Ottawa for observational studies, ROBINS-I where it applies, and the judgement to tell a genuine limitation from a fatal one. Screening a few hundred papers teaches you what good looks like faster than any methods textbook.
Key Takeaways
A good case-control study is not simply cases versus controls. Its strength comes from how the cases are defined, where the controls come from, whether matching is justified, how exposure is measured, and whether the analysis matches the design you choose.
Research Mentorship
Define, select, match, measure, analyse, interpret.
Six stages, and the first two decide whether the other four are worth doing. Most first case-control studies fail somewhere in that opening pair, usually because nobody was there to ask where the controls came from or whether the case definition would survive a reviewer.
The American Academy of Research & Academics works with IMGs and early career researchers on study design, systematic reviews, statistical analysis and publication. Bring us your protocol while the design is still changeable.
Frequently Asked Questions
Q1. What is a case-control study?
An observational study that starts by identifying people with an outcome (cases) and without it (controls), then compares their previous exposure.
Q2. How do you select controls in a case-control study?
Choose them from the same source population that produced your cases, using eligibility criteria set independently of exposure status.
Q3. What makes a good control group?
Controls who would have been counted as cases if they had developed the outcome, and whose exposure can be measured the same way as in cases.
Q4. What are the types of matching in case-control studies?
Individual matching and frequency matching.
Q5. What is the difference between individual and frequency matching?
Individual matching pairs each case with specific controls. Frequency matching makes the overall distribution of a characteristic similar across the two groups.
Q6. How is the odds ratio calculated in a case-control study?
From the 2 × 2 table: OR = (a × d) / (b × c), where a and b are exposed and unexposed cases, c and d are exposed and unexposed controls.
Q7. How do you interpret an odds ratio?
OR = 1 means no association, OR greater than 1 means higher odds of exposure among cases, OR less than 1 means lower odds. Always read it with the confidence interval.
Q8. What is recall bias in a case-control study?
Systematic difference in how accurately cases and controls remember past exposures.
Q9. How can recall bias be reduced?
Use records and objective measurements, apply standardized questionnaires identically in both groups, and blind interviewers where possible.
Q10. What is a nested case-control study?
A case-control study carried out within an existing cohort, with controls sampled from cohort members still at risk.
Q11. What is incidence-density sampling?
Selecting controls, for each case, from everyone still at risk at the time that case occurs.
Q12. Can a control later become a case?
Yes. In risk-set sampling, someone selected as a control can develop the outcome later and be included as a case.
Q13. What regression is used for matched case-control studies?
Conditional logistic regression may be appropriate for individually matched designs. Frequency-matched and unmatched designs are usually analyzed with logistic regression that accounts for the matching variables.
Q14. What is the Newcastle-Ottawa Scale for case-control studies?
A quality appraisal tool scoring selection, comparability, and exposure ascertainment.
Disclaimer:
Articles published by American Academy of Research & Academics are prepared by our team using information from direct experience, publicly available resources, and educational references. AI tools may be used to assist with drafting, proofreading, and formatting; however, all content undergoes review and approval before publication.
The information provided is intended for educational purposes only. Requirements, policies, and processes may change over time. Readers should consult official sources for the most current information.